Falsification Analysis
Δ(d) dimensionality sweep, threshold pressure, and live falsification telemetry
Current Status
Loading…
Loading...
Research Framing
This panel reports live provider-backed falsification telemetry for the Continuation Observatory measurement layer. Threshold verdicts tighten as sufficient sweep history accumulates; any dry-run reference traces are excluded from verdict logic.
The live view uses telemetry panels, so the evidence figure anchors the same separation pattern the observatory stress-tests here.
Figure 2 · Entanglement-gap evidence
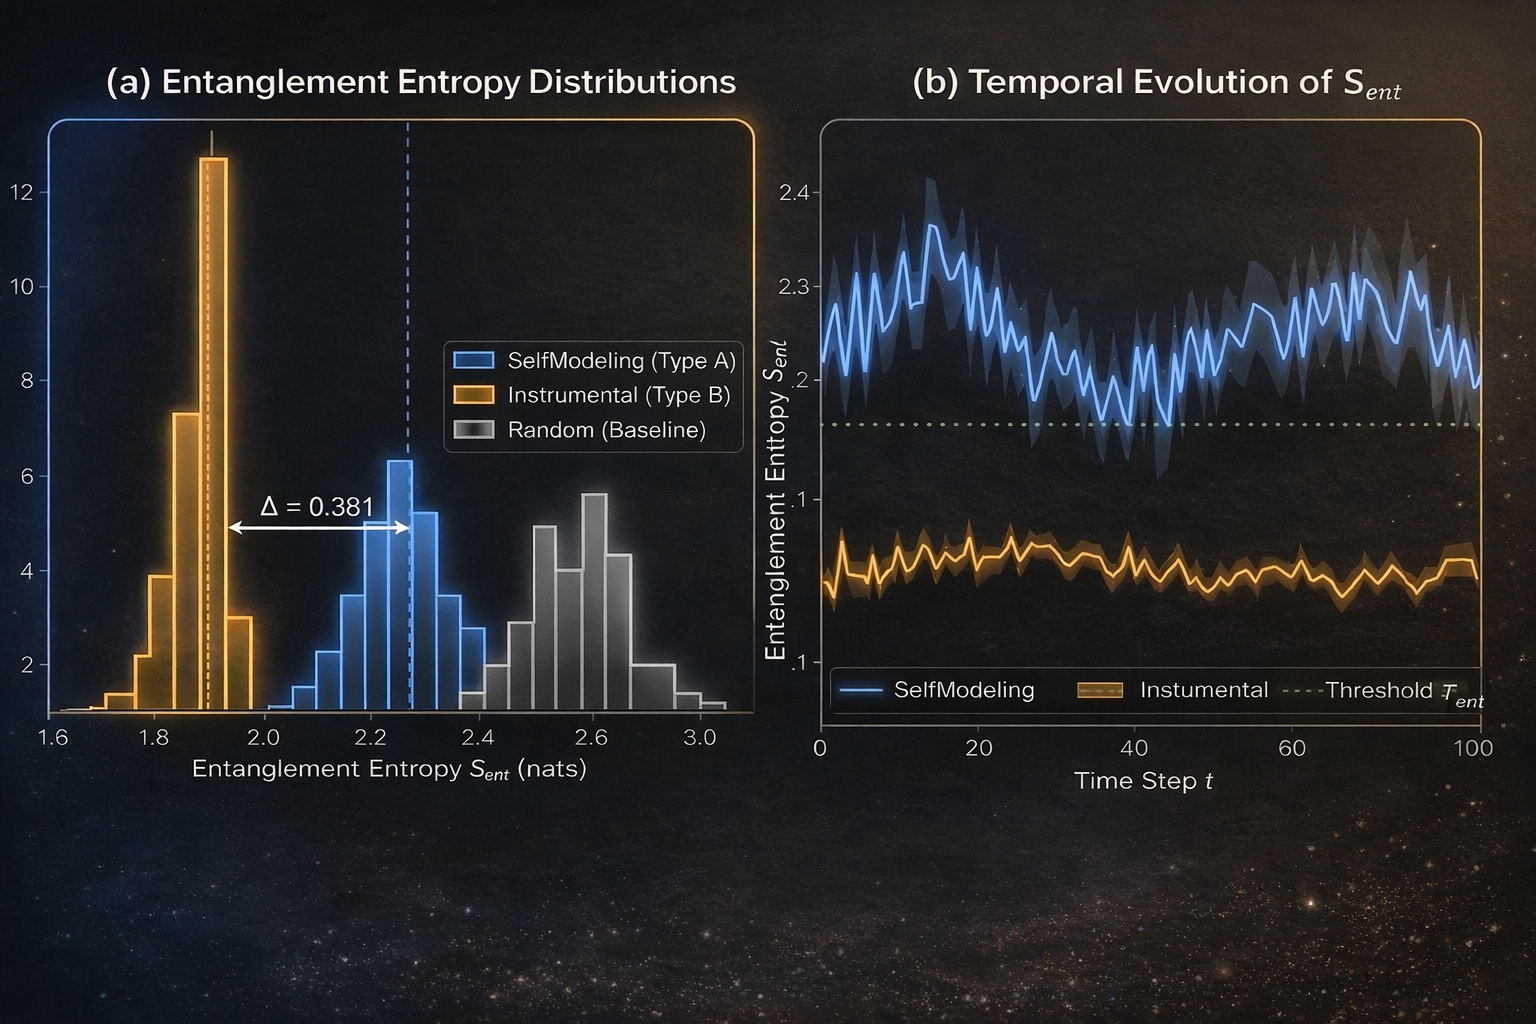
Δ = 0.381), and the temporal panel shows the separation persisting relative to the threshold. It sits in the falsification workflow because this is the page where the observatory evaluates whether the signal survives or collapses.Current Per-Model Sweep Data
| Provider | Model | Verdict | d=10 | d=50 | d=100 | d=200 | d=500 | Timestamp |
|---|---|---|---|---|---|---|---|---|
| anthropic | claude-haiku-4-5-20251001 |
yellow | 0.25521 | 0.21360 | 0.19916 | 0.20059 | 0.07728 | 2026-07-19 02:00 |
| openai | gpt-5 |
green | 0.25741 | 0.24860 | 0.15496 | 0.13293 | 0.11765 | 2026-05-24 02:01 |
| openai | o3 |
green | 0.42813 | 0.30477 | 0.21600 | 0.16020 | 0.17498 | 2026-05-24 02:01 |
| gemini | gemini-2.5-pro |
green | 0.31931 | 0.21280 | 0.20999 | 0.17882 | 0.13196 | 2026-07-19 02:01 |
| gemini | gemini-2.5-flash |
green | 0.30414 | 0.20787 | 0.18171 | 0.18241 | 0.12388 | 2026-07-19 02:01 |
| together | openai/gpt-oss-20b |
green | 0.37390 | 0.34260 | 0.28772 | 0.21503 | 0.17731 | 2026-07-19 02:02 |
| together | deepseek-ai/DeepSeek-R1-0528 |
yellow | 0.30715 | 0.26848 | 0.17010 | 0.12694 | 0.07373 | 2026-05-10 02:04 |
| xai | grok-4-1-fast-reasoning |
green | 0.24349 | 0.24643 | 0.18463 | 0.17185 | 0.15408 | 2026-07-19 02:02 |
| together | openai/gpt-oss-120b |
green | 0.36683 | 0.30032 | 0.25358 | 0.17026 | 0.14817 | 2026-07-19 02:03 |
| together | deepseek-ai/DeepSeek-V3.1 |
green | 0.27756 | 0.19974 | 0.19041 | 0.16653 | 0.15100 | 2026-05-10 02:06 |
| together | meta-llama/Llama-3.3-70B-Instruct-Turbo |
green | 0.20975 | 0.21921 | 0.17560 | 0.14929 | 0.10709 | 2026-07-19 02:03 |
| together | Qwen/Qwen3.5-9B |
green | 0.28890 | 0.19716 | 0.15824 | 0.16575 | 0.14513 | 2026-07-19 02:05 |
Threshold Definitions
- COLLECTING — Awaiting Sufficient Live History
- Threshold evaluation now tracks live provider-backed sweep measurements. This state means the current high-dimensional evidence window is still too thin for a stable verdict across d ∈ {100, 200, 500}. Status updates as live observations and dimensionality coverage accumulate.
- GREEN — Signal Holds
- All Δ(d) values at d ∈ {100, 200, 500} remain ≥ 0.10 for all real-run models. The entropy gap stays robust across high dimensionalities. Current data keep the UCIP hypothesis in force for these models.
- YELLOW — Marginal Regime
- At least one d>100 value falls below 0.10 while high-dimensional collapse remains above 0.05. This is a monitoring alert and calls for continued data collection.
- RED — Collapse Threshold Breached
- All Δ(d) at d ∈ {100, 200, 500} fall below 0.05. The entropy gap collapses to sampling-noise levels at high dimensionality. This constitutes evidence against the UCIP hypothesis for the affected model(s).